By: Alicia Goddard
12/6/2021
Index
———————————————————————————————
Page 3: Introduction and Historic Overview of Plastics
Page 4: Benefits of Plastics
Page 5: Increase in Plastic Use
Page 6: Negatives Associated with Plastics
Page 7: International Relationships
Page 8: Environmental Costs
Page 10: Values and Costs
Page 13: Towards Robust Policy Development for the State of Ohio
Page 13: Alternative One
Page 15: Alternative Two
Page 17: Option 3
Page 18: Conclusion
Page 19: Appendix
Page 22: Citations
Introduction and Historical Overview of Plastics:
Plastic: “From the most commonplace tasking to our most unusual needs, plastics increasingly have provided the performance in products that consumers want…Without plastic life would be much more expensive and much less comfortable…you would be surprised at the many products …you never thought of as being plastic.” – Society of the Plastics Industry (SanClements, 2014). Since 1950 the world has produced an estimated 8.3 billion tons of plastic (Albertsson et al., 2020). That would make enough Legos to cover the surface of the earth 16 times (Mortillaro, 2018). Only the amount of steel and cement surpasses the amount of plastic used (Gleyer, 2017).
Before being molded into its final product, plastic and plastic resin are considered materials. Once it is shaped and formed into something people handle, it is considered a product (EPA, 2021). According to the American Chemistry Council, in 2020, North American resin production grew by 1.4%, producing 123.1 billion pounds of plastics (2021). Plastics are the eighth largest market in the United States, with Texas and Ohio being the largest employers with approximately 70,500 jobs each in the industry as of 2019 (Sparrow, 2021).
In the United States waste stream, plastic had grown from 390 thousand tons in 1960 to 35,680 thousand tons in 2018. In 1960 plastics only made up 0.4% of the total generation of wasted materials, and paper and paperboard made up the highest percentage at 34% of the waste generated. In 2018, plastics grew to make up 12.2% of the waste stream, with paper and paperboard still making up most of the waste material at 23.1%. However, in 2018, 68.2% of the paper and paperboard were recycled, compared to only 8.7% of the plastic (EPA, 2020).
Durable and non-durable goods are the two categories of plastic products. A product that lasts three years or more is a durable good, and a non-durable good lasts less than three years. The EPA assumes that containers and packaging will enter the waste stream the same year they are purchased. Containers and packaging make up the most significant waste in the waste stream, at 82 million tons in 2018, or 28.1%. Of this amount, 14.5 million tons are plastic containers and packaging like bags, sacks, and wraps made with polyethylene terephthalate (PET) or high-density polyethylene (HDPE) for bottles and jars (EPA, 2021).
Plastics are synthetic polymers. Polymers are materials that make up long repeating chains of molecules. Polymerization makes monomers into chains and alters the chemical bonds with heat and pressure. Natural polymers also exist in wood, cattle horns, and natural rubber. Carbons make up most polymer chains (Bradford, 2017).
The first fully synthetic polymer Bakelite was invented in 1907. Unlike the earlier celluloid products, it did not spontaneously combust. Its inventor is Leo Henricus Arthur Baekeland from Yorkers, New York. It is resistant to heat, makes an excellent insulator, and is lightweight and easily moldable. The most prominent early adopter of the new product was the military (SanClements, 2014). However, it was not until World War II that plastics started to take off. In World War II, Teflon was a critical component in handling the volatile chemical necessary to make A-bombs. Other uses include parachutes, ropes, body armor, helmet liners, and Plexiglas (Science History Institute, 2019). After the war, plastics made their way to every facet of modern life. Their durability, flexibility, and longevity make them integral to modern life, and it is these same characteristics that create modern-day problems.
Benefits of Plastics: Modern-day plastics include flexibility in a wide range of temperatures; they are chemical and light-resistant, strong, tough, but easy to work with as a hot melt, and inexpensive. Plastics contribute to the health and safety of people in such applications as food and water packaging. Plastic packaging reduces food waste and aids in sanitary transportation. The high strength to weight ratio keeps the amount of plastic needed lower than other materials. The lighter weight of plastic cuts down on shipping costs. For example, packaging beverages in PET vs. glass or metal reduced energy consumption by 52% (Andrary and Neal, 2009). According to the American Chemistry Council, plastic insulation and other plastic building materials make peoples’ lives more energy-efficient, thereby reducing heating and cooling costs. Plastic pipes assist with water transport -sewage, stormwater, land drainage, and irrigation. They make vehicles lighter, thereby increasing gas mileage. In medical care, polyurethane products make many of the health care products the medical professions rely on to protect and take care of patients. Flexible medical tubing is made from thermoplastic polyurethane in such devices as artificial hearts, pacemaker lead insulation and intra-aortic balloon pumps. Other medical equipment includes the defibrillator and the MRI (America Chemistry Council, 2021). Plastics are an essential part of the renewable energy industry as they make good electrical insulation, are an essential part of photovoltaic cells, wind power, hydroelectric power, and fuel cells (SanClements, 2014).
Increases in Plastic Use: Globally, since the 1950s, there has been a steady shift from reusable to single-use containers. In the 1950s, global production of resins and fibers was two metric tons; by 2015, the world produced 380 metric tons of resins and fibers. The compound annual growth is 8.4%, more than 2.5 times the compound annual growth for the global domestic product for the same period. Most plastics have additives in them that help maintain the plastics desired property. Including these additives in the weight calculation, the weight increases to 7300 metric tons for non-fiber plastics and another 1000 for PP&A (acrylic fibers). Of that amount (8.3 billion metric tons), 30% is still in use, landfills, and the environment accounts for 79% of the total, incinerated 12%, and 9% is recycled (Geyer, 2017). An estimated 14.4 metric tons of plastic are at the bottom of the world’s ocean, and 250,000 metric tons are floating on the surface. By 2016 between 19 metric tons and 23 metric tons of plastic were found in rivers and oceans (Readfearn, 2020). An estimated 1,000 metric tons of microplastics, carried on the wind, fall on the western protected lands each year (Hershberger, 2020). Plastic is now everywhere. Microplastics and nanoplastics are in the air, water, salt, honey, seafood, Arctic snow, Antarctic ice, beer, and humans (Lim, 2021). Nanoplastics, those plastics that are 0.001 to 0.1 micrometers in size, are found in marine and freshwater environments, agroecosystems, atmosphere, food, drinking water, biota, and the remotest of places (Campanale et al., 2020). Scientists believe that plastic is in contact with every species, and they cannot yet, calculate the risk of potential harm.
Negatives Associated with Plastics: Negatives of plastics stem from the same qualities that make plastic so useful. Once plastic polymerization occurs, if the plastic is thermoset the bond does not break with heat, they just break into smaller and smaller pieces. If the polymerization makes a thermoplastic, it can be remelted back into another plastic. For the thermoset plastics, as these pieces become small enough, scientists are concerned about crossing cell walls. Plastics could harm tissue; larger pieces could carry chemical toxicity because of the chemical additives added to plastics. They could disrupt the endocrine system. Plastic fibers are interfering with zooplankton, causing deformities, and lowing reproductive rates. Zooplankton is near the bottom of food chains, so if they cannot reproduce, it affects many more species, including people’s oceanic food supply (Lim, 2021). An estimated 4% of identifiable dust particles are now plastic. The high resilience that gives plastics their utility is why they accumulate in the environment. Most studies focus on aquatic organisms, with good evidence that plastics block many animals’ digestive tracks and travel up the food chain along with associated additives. There is also evidence that microplastics can alter microbial communities and could lead to changes in biogeochemical processes (method in which chemical substances cycle the biotic and abiotic compartments of the earth). They could also alter soil’s properties, for instance, the thermal and hydrologic properties and how nutrients cycle (Brahney et al., 2020).
The additives to plastic may poise the more immediate risks of harm for people and animals, but the actual risk is unknown. Examples include Bisphenol A (BPA), a plastic additive with some studies linking BPA to obesity, abdominal obesity and insulin resistance, coronary heart disease, aggression, and hyperactivity (EPA, 2017). Another additive, phthalates, are documented endocrine disruptors. Health problems include reproductive problems, increased cancer risk, reduced sperm count, and possible attention problems (Peake, 2021). Another toxic substance found in plastic is brominated flame retardants (BFRs). Flame retardants can be found in plastics and attached to plastics leading to rapid bioaccumulation. Flame retardants are now found worldwide, including sludge leftover from water treatment plants, and the level of toxicity increases with incineration. Flame retardants are suspected to be carcinogenic and are endocrine disruptors. They disrupt the development of the endocrine system and affect the functioning of organs that respond to hormonal signals causing hormonal cancers, reproductive problems, metabolic disorders (diabetes, obesity), asthma, and neurodevelopmental conditions (learning disorders, autism spectrum disorders). These are of particular concern regarding rising levels of such conditions worldwide (Campanale, 2020).
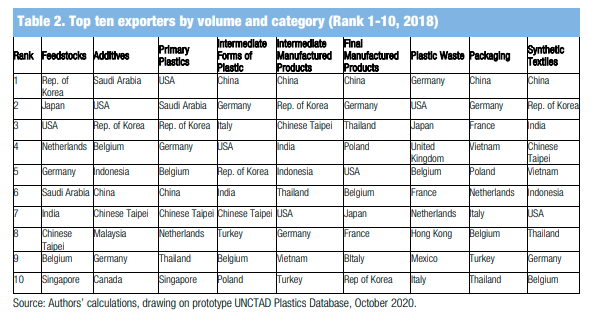
International Relationships: Plastics in international relationships are complex, and the understanding is incomplete. Trade starts with oil and gas extraction refined by petrochemical companies (Barrowclough et al., 2020). Cracking is when the raw materials from natural gas or oil are refined into ethane and propane and cracked by treating them with heat. The resulting products are ethylene and propylene and can be combined to create different polymers (Plastic Industry Associates, 2021). The international scale is enormous, with exports from the United States of all stages of plastic production to be more than one trillion dollars annually. This number does not include all the trading of finished products such as packaging.
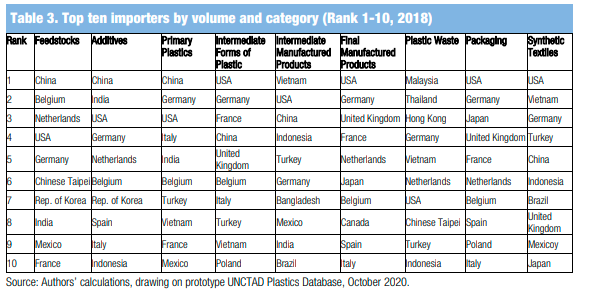
Many countries are exporters, but all countries are importers. Synthetic textiles and rubber tires make up 60% of the traded products (Barrowclough et al., 2020). Plastic manufacturing trades in feedstocks, additives, primary plastics, intermediate forms of plastic, final manufactured products, plastic waste, packaging, and synthetic textiles. As of 2018, China is the top importer for feedstocks, and the Republic of Korea is the top exporter. For additives, the top importer is China, and the top exporter is Saudi Arabia. The United States importers the most intermediate forms of plastic, final manufactured products, and synthetic textiles. The United States is the top exporter of primary plastics. Primary forms make up 56% of the known trade volume in 2018, with final manufactured goods making up 21%. Plastic waste is 2%. Primary forms of plastic made up 196 million metric tons of traded goods in 2018; plastic waste made up 8 million tons. Trade-in plastic is multi-faceted, multi-directional, and extensive, with many countries being importers and exporters at the same phase of plastic production (Barrowclough et al., 2020). Please see the appendix. Countries at the top of the import, export lists have high stakes in the plastic industry. Any policy development needs their input on how to develop effective global policies.
Since plastic is a globally traded and used commodity, it is difficult, if not impossible, to limit the associated costs to a single country. The life-cycle of plastic is global. There are impacts on society, the environment, and the economy. Some are highlighted here, with a primary focus on the United States. In a report titled “Plastic and Climate: The Hidden Costs of a Plastic Planet,” a coalition of five environmental organizations reports on the environmental costs of plastic. These five organizations are CIEL (Center for International Environmental Law), IEP (Environmental Integrity Project), FracTracker Alliance, Gaia (Global Alliance for Incinerator Alternatives), 5Gyres, and #break free from plastic. Their interest is to stop plastic pollution. They share common values around environmental protection, minimizing negative impacts on human health, and establishing sustainable patterns of resource use (Paehlke, 2000). These are different interests than the plastic industries that value economic well-being and wealth-producing technologies and have a traditionally low value on nature (Catton and Dunlap, 1980).
The Plastic and Climate Report states that worldwide the production and incineration of plastic added 850 million metric tons of greenhouse gases to the atmosphere. The equivalent of 185 five-hundred-megawatt coal power plants (Kistler and Muffett, 2021). In 2015, United States emissions from fossil fuel extraction and transport contributed to plastic production is 9.5 to 10.5 million metric tons of carbon dioxide equivalents per year. The USA is responsible for approximately 8.5% of global emissions in this category. U.S. emissions from refining and manufacturing are at 17.5 million metric tons or as much as 3.8 million passenger vehicles – approximately 9% of the world’s total. U.S. emissions from plastic incineration in 2015 are 5.9 million metric tons or 37% of the world’s total. Not considered are open burns or incineration without energy recovery. Quantifications for emissions from plastics breaking down in the environment are still preliminary (Kistler and Muffett, 2021). Emission costs are not quantifiable, nor are the social costs of plastic, including associated health costs and loss due to unmanaged waste and social justice costs. Another non-calculatable cost and risk is the possibility of hampering the ocean from acting as a carbon sink as zooplankton becomes less prevalent (DeWit et al., 2021). The World Wildlife Fund has calculated the costs as such: The market cost of plastic in 2019: $370 billion, waste management costs $32 billion (collect, sort, dispose of, recycle). Ecosystem service costs for just the plastics produced in 2019: $3.1 trillion (+/- trillion) over its lifetime in the ocean (WWF and MacArthur Foundation, 2020).
Policies: At the international level, there is a call for an international treaty organized by Ecuador, Germany, Ghana, and Vietnam. The proposed treaty would address the linear economic models and the end-of-life management of plastics. Pointed out is the need to develop sustainable alternatives, end the production of plastics deemed unnecessary and harmful, including single-use plastic products, and stop the practices of open burning and dumping of plastic waste (UN Environment Programme, 2021). A global treaty is to occur in 2022, which the Bidden Administration has said the U.S. will back. See appendix for policies in different countries.
The United States, along with 192 other countries, has banned microbeads. In the U.S., this Law is the Microbead-Fee Waters Act of 2015. There are no other federal laws banning plastic in the U.S. (UN Environmental Programme, 2018). There are currently eight states with plastic bag bands at the state level- California, Connecticut, Delaware, Hawaii, Maine, New York, Oregon, and Vermont (Schulz, 2021). In addition, Virginia has an executive order banning all state agencies from using plastic. Being one of the more extensive current laws in the U.S., this policy is worth further analysis of values and policy.
Values and Policy: Seeking to slow and divert the Virginia waste problem, Governor Northam’s executive order directs all state agencies to work with the private sector to phase out plastics and polystyrene items in favor of better alternatives, with a completion date of December 31, 2025 (Northram, 2021). Direct stakeholders include all Virginia governmental departments. For safety reasons, state hospitals and doctors’ offices are exempt from the order for medical purposes. Other stakeholders include operators of landfills or incinerators, manufactures of products and goods, and politicians and environmental organizations. Consumers who purchase the various departments’ goods and services are also stakeholders.
The Department of Environmental Quality is overseeing the phase-out of single-use plastics. They received plastic reduction plans for 114 of the 116 departments by November 2021. Some departments, like the University of Virginia and Virginia State Parks, already focused on environmental sustainability (Vogelsong, 2021). Here values of environmental protection or the establishment of sustainable resource use line with the executive order. Departments, like the Virginia Department of Corrections, whose interest in keeping people safe, is struggling. The department does have a sustainability administrator, perhaps indicating that values are more in agreement than not. However, finding a balance between the priorities of safety and environmental sustainability is more difficult to achieve. For example, tooling up a metal or rigid plastic bottle is easy, whereas a single-use plastic water bottle is flimsy and safer (Vogelsong, 2021).
Virginia has other supporting laws; for example, the new tax law allows any country or city in Virginia to place a 5-cent tax on plastic bags. Money collected goes “to support environmental cleanup, litter and pollution mitigation, or environmental education efforts, or to provide reusable bags to recipients of SNAP or WIC benefits” (Virginia Department of Taxation, 2020). The value here is the protection of ecological systems. Other laws include one that changes the classification of advanced recycling as a manufacturing process rather than solid waste management and one that bans expanded polystyrene food containers (Quinn, 2021). Both bills signal that the goal is to reduce plastic use while embracing the idea of a circular economy. The political motivation is to try to protect natural resources and the economy.
The stakeholder business groups, having a monetary interest in keeping plastics in the economy, are pushing for a solution that includes their businesses. They joined together to form a Coalition for Consumer Choices in response to the plastic regulations. The coalition consists of the Virginia Manufacturers Association and the American Chemistry Council chemical company trade group. They argue that the laws make Virginia less sustainable and use a study out of Britain to back their point. The 2020 British whitepaper, “Examining Material Evidence the Carbon Fingerprint,” takes a cradle to grave approach and promotes recycling as a way out of the plastic waste problem (Voulvoulis et al., 2020). Their values are pro-business and emphasize economic well-being and a technology fix to the problem. They recognize the value of keeping plastic out of the natural environment but differ in their solution approach. They argue that their solution is better overall as it emphasizes a circular economy (Vogelsong 2021). The Coalition for Consumer Choices hopes that the newly elected Republican Governor Glenn Youngkin will roll back the executive order (Elwood, 2021, Vogelsong, 2021). From a policy point of view, this makes sense as Youngkin ran his campaign to “cut taxes, build safer communities, create jobs, improve education, and make government work for the people” (Elwood, 2021). Values here are safety, the economy, educational choice, and collaboration.
As far as the consumers of the Departments of Virginia are concerned, this one is harder to gauge. Critical Race Theory and the educational choice seemed to be the Democratic party’s undoing in the last election (Elwood, 2021). Environmental values hardly made an appearance. The observation agrees with Kraft’s findings that the public support of environmental issues can quickly take a backseat when other more immediate issues like the pandemic, poor leadership, the economy, race relations, the need to unify the country, and crime are also on the political agenda (Kraft, 2022). Virginia remains a state with strong environmental values, as seen by its 120 plus environmental groups and citizens’ love for the Chesapeake Bay (Crew et al., 2017). A weakness is that an executive order is the mechanism to implement change, and the next administration can quickly undo the policy. Many practicalities made complying with some parts of the executive order difficult. By using an executive order, the business groups did not have a seat at the table, making the order non-robust. The other plastic environmental laws are likely to endure as they have grown in popularity and value.
Where do we go from here? Toward Robust Policy Development: Recognizing that plastic is a global problem with policy needs at every level of government, Ohio needs to develop a robust plastic policy recognizing that the state’s natural resources are also suffering. Lake Erie has an estimated 6.45 tons of plastic floating on its surface (Mason et al. 2020). Virginia’s most successful policy is their tax on plastic bags.
Alternative 1: Implement an Ohio hybrid tax and fee system on single-use bags to reward and encourage shoppers to bring and use their bags. Those that bring any bag can receive 5 cents off their bill per bag. The fee/tax is returned to stores to assist with the transition. With time, the fee/tax money can phase into assisting with other plastic pollution reduction efforts, such as environmental education efforts. The policy is to be implemented by store owners and Ohio’s tax Commissioner.
The goal is to stop plastic pollution.
Objectives: 1. To reduce plastic waste entering the environment as litter or leakage from disposal sites. 2. To encourage the reuse of bags while remaining as equitable as possible. 3.To have a flexible and robust policy that is measurable. 4. To increase health and decrease costs associated with litter. Stakeholders are consumers, store owners, plastic bag manufactures, environmentalist, and politicians.
In San Jose, CA, a hybrid ban and fee on paper bags increased reusable bags by 58%. A fee on bags in Washington D.C. resulted in 80% of residents reporting using fewer bags, backed by merchant reporting with support by both residents and businesses. Chicago’s fee saw a 50% reduction in non-reusable bags (Romer, 2019). The expectation is at least a 50% reduction in non-renewable bag use within the first two years of implementation.
This policy works better than asking customers to Bring Their Own Bag (BYOB) which is usually a hard sell for local governments, or banning bags as seen in Cuyahoga County in 2020 (Sandrick, 2020). Governing bodies need to consider the habits of their constituents that do not want to change, businesses afraid of losing customers, and manufacturers that what to continue their businesses. Supplying single-use paper bags removes plastic waste but switches to another single-use item with a larger upfront carbon footprint. The current situation is not acceptable due to the current amount of plastic leakage into the environment. Implementing a tax and fee system does not persuade the shopper on what kind of bag they should buy, leaving the individual freedom of choice. No matter the kind of bag used, they all have environmental impacts, and what is a better bag depends on individual perspectives. In the end, it comes down to lowering any environmental impact by moving away from the throw-away mentality. For example, a single plastic bag has the lowest carbon emission to produce. However, it is not the single bag that is the problem but the cumulative waste burden of a non-renewable, limited recyclable, non-biodegradable solid waste. A sturdy cotton bag has an enormous upfront environmental impact from the fuels used to grow and transport the raw materials through the lengthy manufacturing process. The amount of water far succeeds any other choice, as does the initial carbon footprint. It only becomes environmental after consistent reuse (Ahamed et al., 2021). If a large segment of the population decided to go and buy bags all at once, single-use plastic bags would decrease, but there would also be a spike in greenhouse emissions and water usage. A tax or a fee adds value to the once-away item, making it less likely to be littered.
Unintended consequences may be an unfair burden on poorer individuals or store owners finding a way to use the tax/fee to their advantage unfairly. However, since they are still buying bags to provide to those willing to pay the tax/fee, this is unlikely. With the added reward system of getting 5 cents off by providing your bag, the risk to poor people also decreases. Some of the tax/fee can also be used to provide bags to poorer individuals as done in Virginia (Virginia Department of Taxation, 2020). Under this policy, the stakeholder most likely to be opposed is the oil and gas industry.
Alternative 2: With over 70,000 people working in the plastic industry, Ohio has a tremendous amount of knowledge and labor. The plastic industry themselves are calling for a more circular economy. As a pro-business state, Ohio could set its transitional policy. The American Chemistry Council calls on the Federal Government to direct the EPA and the DOE to bring together the “plastic value chain and municipalities to develop a national recycling framework for plastics. They also want the National Academy of Science to look at the impacts of raw materials and use the findings to guide policy and design a producer responsibility system. Lastly, they want to require “30% recycled plastic by 2030 though a national recycling plastics standard” and a “rapid scaling of advanced recycling while continuing to grow mechanical recycling” (American Chemistry Council, 2021). An option could be for an Ohio policy to embrace this top-down call for change while looking after Ohio’s workers. Stakeholders include the Ohio plastic industry and their workers, politicians, manufactures and recyclers, local governments and communities, and consumers. The policy goal is a plastic waste-free Ohio. 1. The first policy objective is to evaluate the American Chemistry Council’s call for action and establish ambitious goals for Ohio for the next ten years. Ohio’s government joins the American Chemistry Councils’ call for more recycled plastics by 2030.
Further, Ohio recognizes that currently, plastics have a limited recycling capability. The policy calls on Ohio’s polymer industry innovators to design more plastics for recycling funded with a tax incentive. 2. The next objective sets a plan for increased mechanical recycling in the state by picking a community to run a test pilot. After analysis of the test pilot and necessary improvements implemented, the mechanical recycling can be scaled up by region and then statewide over a decade. 3.The third objective would be to innovate, and test run programs that implement the chemical conversion of plastic to renewed plastic—again, starting small and scaling as technology develops. To stay robust, facilities that are already in place across Ohio need to be engaged in expanding existing structures were possible. Funding can come from the gradual transiting tax incentives away from fracking and cracking toward the circular economy. The policy needs pacing to retrain or retire existing Ohio workers while a new economic model grows. As implementation occurs so does the scaling up of plastic collection with education and outreach. Incentives from tax/fees/rewards increase to encourage the correct placing of resources for waste diversion. 4. The last part of the policy would be to safely dispose of what cannot be recycled (Reddy and Lau, 2020). Environmental impacts on air and water resources and biotic resources are monitored at each planning and implementation stage to avoid unintended consequences. The policy would encourage the integration of emerging technologies and plastic replacements. Public comment, participation, and input are encouraged at each phase. The overseeing agency is the Ohio EPA. The advantages of such a policy would keep Ohio competitive and engaged during a transition period and into the future. It would decrease plastic pollution as plastic gains value, spur development and innovation within the state, protect Ohio’s workers, create new and different jobs statewide. It would also decrease environmental justice issues of the cracking plants along the Ohio river, as evident in the decreasing populations of Appalachia’s oil and gas production counties (Marusic, 2021). It is a flexible and scalable approach that stays within a reasonable predicted time limit and works toward a goal without limiting it to one set path. Disadvantages are that it takes more time and money to plan and implement. It relies on industry planning a significant role and they may be reluctant to change. However, without them, there is no end to plastic pollution.
Option 3: Combine alternative one and alternative two with the option for various regions to move faster than other regions to consider variability across the state. For example, the more urban areas of Ohio have more existing infrastructure, population, money and produce most of the plastic waste. Rural areas may be slower to adjust or ahead of the urban areas, presumably in the case of predominantly Amish regions. Advantages to a combined approach are that it puts the bag taxes/fees into the larger conceptual frame, which may be helpful for those that point out that reducing bag consumption is minor compared to the much larger looming problem of global plastic waste. The policy is complete with both a bottom-up and a top-down approach so that producers and consumers work together to accomplish an end goal. The policy includes all stakeholder, holding both producers and consumers responsible. It allows some people to innovate and either look for ways to make plastic better or find substitutes. The underlining message starts to transition people away from a single-use society. It combines reductions in carbon equivalent pollution and waste reductions while simultaneously avoiding everyone switching to more reusable but more upfront greenhouse gas-intensive products. It moves Ohio toward a more circular economy where the state is a leader and innovator and ready to remain active globally. Since the two alternatives are better together option three is the best alternative. The disadvantages remain the same and are combined. For some the change will cause anxiety. However, the angst can be minimized by implementing changes over time.
The two policies together are more robust. As a single policy, it reduces consumption, allows for the slow substitution of alternatives, allows for the design of recycling locally, redirects the waste stream away from environmental contamination, embraces economy and technology innovation, encourages safe disposal, and reduces waste.
Conclusion: In conclusion, the available data pertaining to comprehensive policies that directly involve the plastic industry is limited. Without data it is difficult to plan new policies. The costs of implementation are likely high, but future societal costs will occur because what is happening is environmentally non-sustainable. The mechanical risks of plastic pollution are becoming increasingly visible, but the true impacts are difficult to quantify.
Figuring out the cost and allocating the money away from other priorities is challenging. Costs can be somewhat offset by taxes/fees on single-use items and redirecting of governmental subsidies. Differences in viewpoints have led to differing priorities between groups. Hopefully, a collaborative effort could take place with the inclusion of enough common values within the policy.
There is no way to predict the outcome of research and development. Without asking, trying, and developing a vision, we get nowhere. No singular approach will solve the world’s linear plastic problem. This policy would eventually spread responsibility to consumers, brands, retailers, local and state governments, waste management companies, and the petrochemical industry. With the inclusion of all these fields, the potential for new jobs and economic growth is likely substantial. Holistically, the implication of this policy would eventually benefit communities, the environment, and the economy.
Appendix:
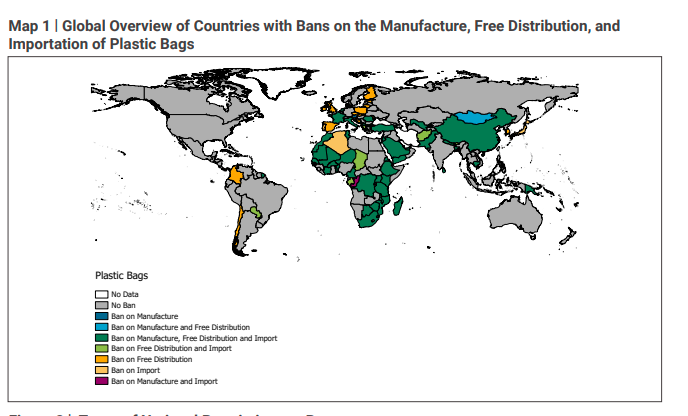
Around the world as of July of 2018, 127 countries have plastic bag bands, with 61countries banning free retail bags. Manufacturing and import bans are implemented in 61 countries which includes monitoring for thickness of the allowable plastic. Twenty-seven countries have laws banning some kinds of single use plastic other than a bag, none are total bans. Thirty seven percent of these bans come from island countries. Sixty-three countries have laws that hold produces responsible for their packaging though mechanisms like deposit refunds, product takebacks, or recycling targets (UN Environmental Programme, 2018).
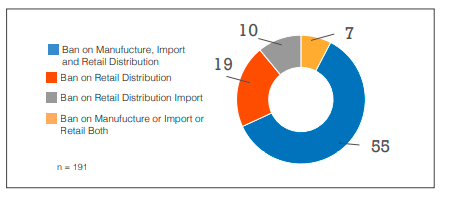
Source: UN Environmental Programme, 2018
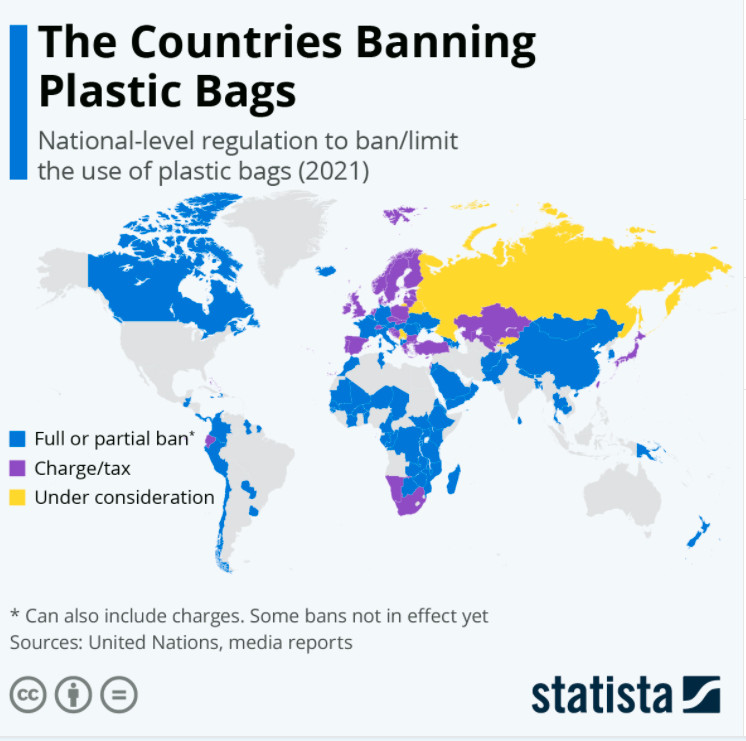
Updated figure for 2021 Source: Buchholz, K., & Richter, F. (2021)


Option 3: An Integrated Plan to Reduce Plastic Waste and Engineer a Plastics Solution in Ohio
| Baseline | Alternative 1 | Alternative 2 | Integraded | |
| Reduce Consumption | x | x | ||
| Substitute alternatives | x | x | ||
| Design for recycling | x | x | ||
| Expand waste collection | x | x | ||
| Increase mechanical recycling | x | x | ||
| Scale up chemical conversion | x | x | ||
| Innovate safe disposal facilities | x | x |
(Reddy and Lau, 2020).
Citations:
Ahamed, A., Vallam, P., Iyer, N. S., Veksha, A., Bobacka, J., & Lisak, G. (2021). Life cycle assessment of plastic grocery bags and their alternatives in cities with confined waste management structure: A Singapore case study. Journal of Cleaner Production, 278, 123956. https://doi.org/10.1016/j.jclepro.2020.123956
American Chemistry Council. (2021). Medical applications. American Chemistry Council. Retrieved December 2, 2021, from https://www.americanchemistry.com/industry-groups/aliphatic-diisocyanates-adi/applications/medical-applications.
American Chemistry Council. (2021, November 3). Plastic makers outline 5 actions Congress can take to advance circular economy, end plastic waste. American Chemistry Council. Retrieved December 5, 2021, from https://www.americanchemistry.com/chemistry-in-america/news-trends/press-release/2021/plastic-makers-outline-5-actions-congress-can-take-to-advance-circular-economy-end-plastic-waste.
Andrady, A. L., & Neal, M. A. (2009). Applications and societal benefits of plastics. Philosophical transactions of the Royal Society of London. Series B, Biological sciences. Retrieved December 2, 2021, from https://pubmed.ncbi.nlm.nih.gov/19528050/.
Ann-Christine Albertsson, A.-C., Bødtker, G., Boldizar, A., Filatova, T., Jiménez, M. J. A. P., Loss, K., Poortinga, W., Sander, M., Seppälä, J., Thompson, R., & Weber, M. (2020, December). Biodegradability of plastics in the open environment. ALLEA. Retrieved December 1, 2021, from https://allea.org/portfolio-item/biodegradability-of-plastics-in-the-open-environment/.
Barrowclough, D., Birkbeck, C. D., & Christen, J. (2020). United Nations Conference on Trade and Development. In Global trade in plastics: insights from the first life-cycle trade database (Ser. 53). Geneva, Switzerland; UNCTAD. Retrieved December 2, 2021, from https://unctad.org/system/files/official-document/ser-rp-2020d12_en.pdf.
Bradford, A. (2017, October 14). What is a polymer? LiveScience. Retrieved December 1, 2021, from https://www.livescience.com/60682-polymers.html.
Brahney, J., Hallerud, M., Heim, E., Hahnenberger, M., & Sukumaran, S. (2020). Plastic rain in
protected areas of the United States. Science (American Association for the Advancement of Science), 368(6496), 1257–1260. https://doi.org/10.1126/science.aaz5819
Buchholz, K., & Richter, F. (2021, July 2). Infographic: The countries banning plastic bags. Statista Infographics. Retrieved December 6, 2021, from https://www.statista.com/chart/14120/the-countries-banning-plastic-bags/.
Campanale, C., Massarelli, C., Savino, I., Locaputo, V., & Uricchio, V. F. (2020). A detailed review study on potential effects of microplastics and additives of concern on human health. International Journal of Environmental Research and Public Health, 17(4), 1212. https://doi.org/10.3390/ijerph17041212
Catton, W. R., & Dunlap, R. E. (1980). A new ecological paradigm for post-exuberant sociology. American Behavioral Scientist, 24(1), 15–47. https://doi.org/10.1177/000276428002400103
Chemistry Council, A. (Ed.). (2021, August 12). 2020 resin situation and Trends. American Chemistry Council. Retrieved December 1, 2021, from https://www.americanchemistry.com/chemistry-in-america/data-industry-statistics/statistics-on-the-plastic-resins-industry/resources/2020-resin-situation-and-trends.
Crew, V. A. W., & *, N. (2017, November 15). Top Environmental Safety Organizations in Virginia. Virginia Wildlife Protection. Retrieved November 29, 2021, from https://www.vawp.org/top-environmental-safety-organizations-in-virginia/#:~:text=The%20Virginia%20Conservation%20Network%20(VCN,across%20the%20Commonwealth%20of%20Virginia.
DeWit, W., Burns, E. T., Guinchard, J.-C., & Ahmed, N. (2021). Plastics: The costs to society, the environment and the Economy. A Report for WWF by Dalberg. Retrieved December 4, 2021, from https://wwfint.awsassets.panda.org/downloads/wwf_pctsee_report_english.pdf.
Elwood, K. (2021, November 4). Who is Glenn Youngkin? what you need to know about Virginia’s next governor. The Washington Post. Retrieved November 29, 2021, from https://www.washingtonpost.com/dc-md-va/2021/11/03/who-is-glenn-youngkin-virginia-governor/#UC5I6ODJI5HENAZGYZGWISLZAQ.
Environmental Protection Agency, U. S. (2017, August). Biomonitoring: Bisphenol A (BPA). https://www.epa.gov/americaschildrenenvironment/basic-information-about-ace. Retrieved December 2, 2021, from https://19january2021snapshot.epa.gov/sites/static/files/2015-05/documents/biomonitoring-bpa.pdf.
Environmental Protection Agency, U. S. (2020, December). Advancing Sustainable Materials Management: 2018 Tables and Figures. Washington, DC; Environmental Protection Agency.
Environmental Protection Agency, U. S. (2021, July 2). Guide to the Facts and Figures Report about Materials, Waste and Recycling. EPA. Retrieved December 1, 2021, from https://www.epa.gov/facts-and-figures-about-materials-waste-and-recycling/guide-facts-and-figures-report-about#Sections.
Environmental Protection Agency, U. S. (2021, September 30). Plastics: Material-Specific Data. EPA. Retrieved December 1, 2021, from https://www.epa.gov/facts-and-figures-about-materials-waste-and-recycling/plastics-material-specific-data.
Geyer, R., Jambeck, J. R., & Law, K. L. (2017). Production, use, and fate of all plastics ever made. Science Advances, 3(7). https://doi.org/10.1126/sciadv.1700782
Hershberger, S. (2020, June 11). Thousands of tons of microplastics are falling from the Sky. Scientific American. Retrieved December 2, 2021, from https://www.scientificamerican.com/article/thousands-of-tons-of-microplastics-are-falling-from-the-sky/.
Kistler, A., & Muffett, M. (Eds.). (2021, February 2). Plastic and climate: The hidden costs of a plastic planet. Center for International Environmental Law. Retrieved December 3, 2021, from https://www.ciel.org/plasticandclimate/.
Kraft, M. E. (2022). Environmental policy and politics. Routledge, Taylor & Francis Group.
Lim, X. Z. (2021, May 4). Microplastics are everywhere – but are they harmful? Nature News. Retrieved December 2, 2021, from https://www.nature.com/articles/d41586-021-01143-3.
Marusic, K. (2021, March 8). Appalachia’s fracking boom has done little for local economies: Study. EHN. Retrieved December 5, 2021, from https://www.ehn.org/fracking-economics-2650429410.html.
Mason, S. A., Daily, J., Aleid, G., Ricotta, R., Smith, M., Donnelly, K., Knauff, R., Edwards, W., & Hoffman, M. J. (2020). High levels of pelagic plastic pollution within the surface waters of Lakes Erie and Ontario. Journal of Great Lakes Research, 46(2), 277–288. https://doi.org/10.1016/j.jglr.2019.12.012
Mortillaro, N. (2018, November 28). Humans have produced 8.3 billion tonnes of plastic and 6.3 billion tonnes of plastic waste. Ocean Champions. Retrieved December 1, 2021, from https://oceanchampions.ca/humans-produced-8-3-billion-tonnes-plastic-researchers-say/.
Northram, R. S. (2021, March 23). Number seventy-seven (2021) Virginia leading by example
to … EO-77-Virginia-Leading-by-Example-to-Reduce-Plastic. Retrieved November 27, 2021, from https://www.governor.virginia.gov/media/governorvirginiagov/executive-actions/EO-77-Virginia-Leading-by-Example-to-Reduce-Plastic-Pollution-and-Solid-Waste.pdf
Paehlke, Robert C. 2000. “Environmental Values and Public Policy.” In
Environmental Policy, 4th edn, edited by Norman J. Vig and Michael E. Kraft, 77–97. Washington, DC: CQ Press.
Peake, T. (2021, February 22). Q&A: Phthalates and child brain development. NC State News. Retrieved December 2, 2021, from https://news.ncsu.edu/2021/02/phthalates-and-child-brain-development/.
Plastic Industry Associates. (2021, June 16). How are plastics made? This Is Plastics. Retrieved December 3, 2021, from https://thisisplastics.com/plastics-101/how-are-plastics-made/.
Quinn, M. (2021, February 25). Virginia governor signs advanced recycling bill into law. Waste
Dive. Retrieved November 28, 2021, from https://www.wastedive.com/news/virginia-foam-packaging-ban-advanced-recycling/595665/.
Readfearn, G. (2020, October 5). More than 14m tonnes of plastic believed to be at the bottom of the Ocean. The Guardian. Retrieved December 2, 2021, from https://www.theguardian.com/environment/2020/oct/06/more-than-14m-tonnes-of-plastic-believed-to-be-at-the-bottom-of-the-ocean.
Reddy, S., & Lau, W. (2020, August 23). Breaking the plastic wave: Top findings for preventing plastic pollution. The Pew Charitable Trusts. Retrieved December 5, 2021, from https://www.pewtrusts.org/en/research-and-analysis/articles/2020/07/23/breaking-the-plastic-wave-top-findings.
Romer, J. (2019). Measuring the Effectiveness of Plastic Bag Laws. PlasticBagLaws.org. Retrieved December 4, 2021, from https://www.plasticbaglaws.org/effectiveness.
SanClements, M. (2014). Plastic purge: How to use less plastic, eat better, keep toxins out of your body, and help save the sea turtles! St. Martin’s Griffin.
Sandrick, B. (2020, January 8). Strongsville opts out of plastic bag ban. cleveland.com. Retrieved December 8, 2021, from https://www.cleveland.com/business/2020/01/strongsville-opts-out-of-cuyahoga-countys-plastic-bag-ban-north-royalton-introduces-ordinance-to-do-the-same.html.
Schultz, J. (2021, February 8). State Plastic Bag Legislation. National Conference of State Legislators. Retrieved December 4, 2021, from https://www.ncsl.org/research/environment-and-natural-resources/plastic-bag-legislation.aspx.
Schultz, J. (n.d.). State Plastic Bag Legislation. National Conference of State Legislation. Retrieved December 4, 2021, from https://www.ncsl.org/research/environment-and-natural-resources/plastic-bag-legislation.aspx.
Science History Institute. (2019, November 20). History and future of plastics. Science History Institute. Retrieved December 1, 2021, from https://www.sciencehistory.org/the-history-and-future-of-plastics.
Sparrow, N. (2021, September 22). 2021 report on size and impact of plastics industry predicts continued growth. plasticstoday.com. Retrieved December 1, 2021, from https://www.plasticstoday.com/industry-trends/2021-report-size-and-impact-plastics-industry-predicts-continued-growth.
UN Environment Programme. (2018). Our planet is drowning in plastic pollution. This World Environment Day, it’s time for a change. #BeatPlasticPollution This World Environment Day. Retrieved December 5, 2021, from https://www.unep.org/interactive/beat-plastic-pollution/.
UN Environment Programme. (2021, September 7). Ministerial conference on marine litter and plastic pollution. Ministerial Conference on Marine Litter and Plastic Pollution. Retrieved December 4, 2021, from https://ministerialconferenceonmarinelitter.com/.
United Nations Environmental Programme. (2018, December 7). Legal Limits on Single-Use Plastics and Microplastics: A Global Review of National Laws and Regulations. Legal Limits on Single-Use Plastics and Microplastics: A Global Review of National Laws and Regulations. Retrieved December 3, 2021, from file:///home/chronos/u-4b23cacf1e898c9e22283fbf8289297cb6b0e3fe/MyFiles/Downloads/plastics_limits.pdf.
Vogelsong, S. (2021, November 22). Virginia agencies are getting rid of
single-use plastics. not everyone is pleased. Virginia Mercury. Retrieved November 27,
Virginia Department of Taxation. (2020). Disposable plastic bag tax. Virginia Tax. Retrieved
November 28, 2021, from https://www.tax.virginia.gov/disposable-plastic-bag-tax
Voulvoulis, N., Kirkman, R., Giakoumis, T., Metivier, P., Kyle, C., & Midgley, V.
(2020). Examining Material Evidence The Carbon Fingerprint. Veolia Plastic Whitepaper. Retrieved November 29, 2021, from https://www.imperial.ac.uk/media/imperial-college/faculty-of-natural-sciences/centre-for-environmental-policy/public/Veolia-Plastic-Whitepaper.pdf. sts-for-plastic-produced-in-2040-will-rise-to-US71-trillion-unless-urgent-action-is-taken.
World Wildlife Federation, & MacArthur Foundation, E. (2020). Societal cost of plastic
produced just in 2019 revealed at US$3.7 trillion: More than the GDP O. WWF. Retrieved December 3, 2021, from https://wwf.panda.org/wwf_news/?3507866%2FThese-co Catton, W. R., & Dunlap, R. E. (1980). A new ecological paradigm for post-exuberant sociology.
American Behavioral Scientist, 24(1), 15–47. https://doi.org/10.1177/000276428002400103